Investment Planning: Retirement Glide Path
Explore smarter retirement planning beyond target date funds with a customized glide path built for your goals and risk tolerance.

Before assuming my current role, I spent 10 years at Fidelity Institutional Asset Management. Of all the people that I was fortunate enough to work with, Jurrien Timmer would be at the top of the list. He is a master of making extremely complex data easy to understand. As in this current example of putting the current market in historical context.
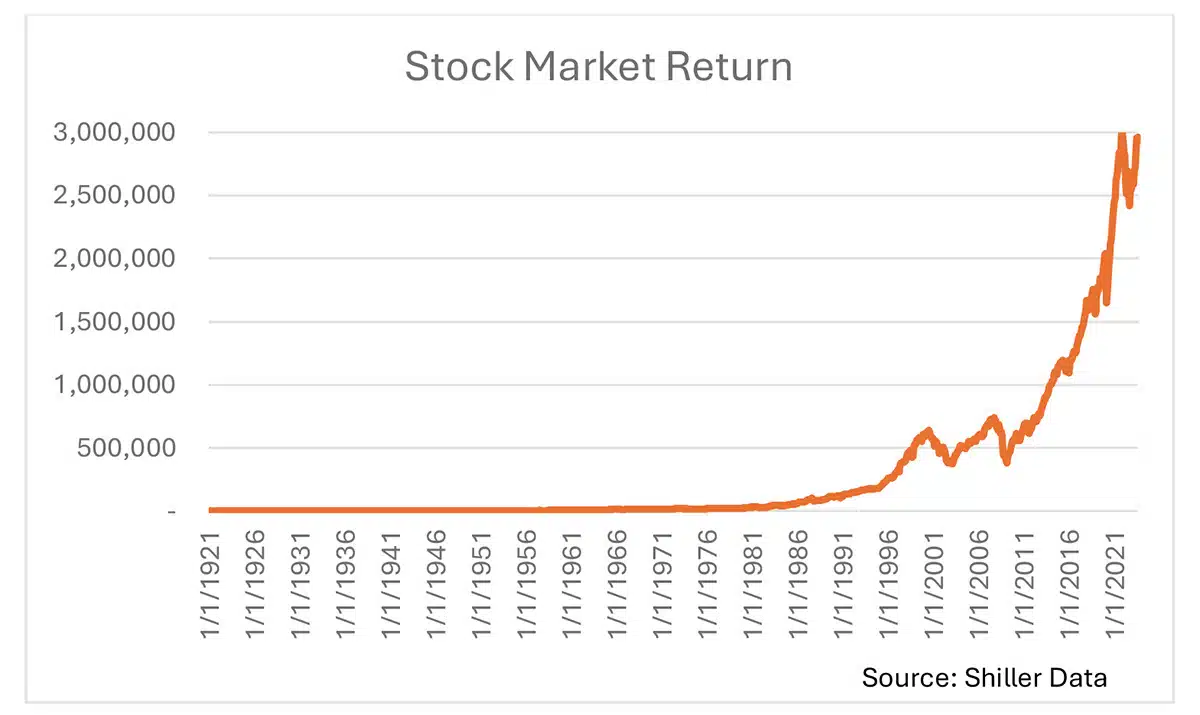
Looking at very long term charts of market indices can be very hard to interpret. In this chart, derived from Yale economist Robert Shiller’s online database, the market seems to languish at zero for six decades before rising. The 1929 market crash doesn’t even register here as the index level today is more than 5,800 times higher than it was in 1921.

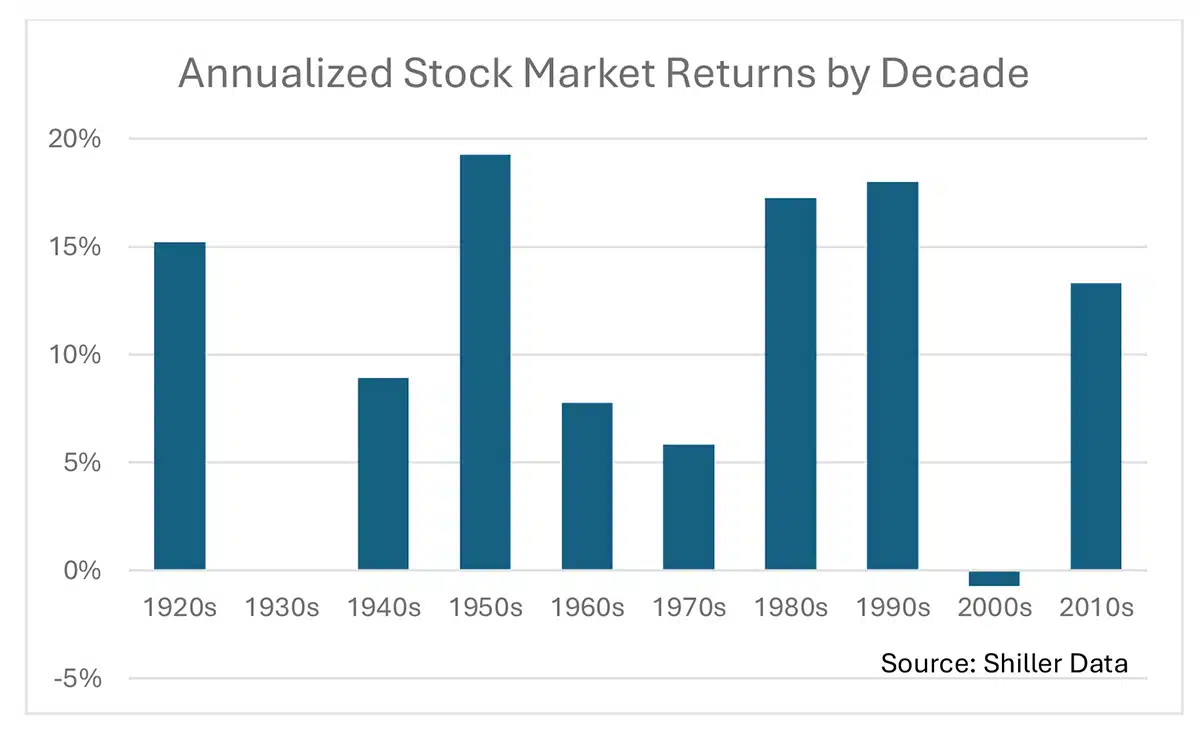
Of course if we look at stock market returns by decade, the picture is substantially different with the highest return coming in the 1950s, which again doesn’t even register in the chart above.

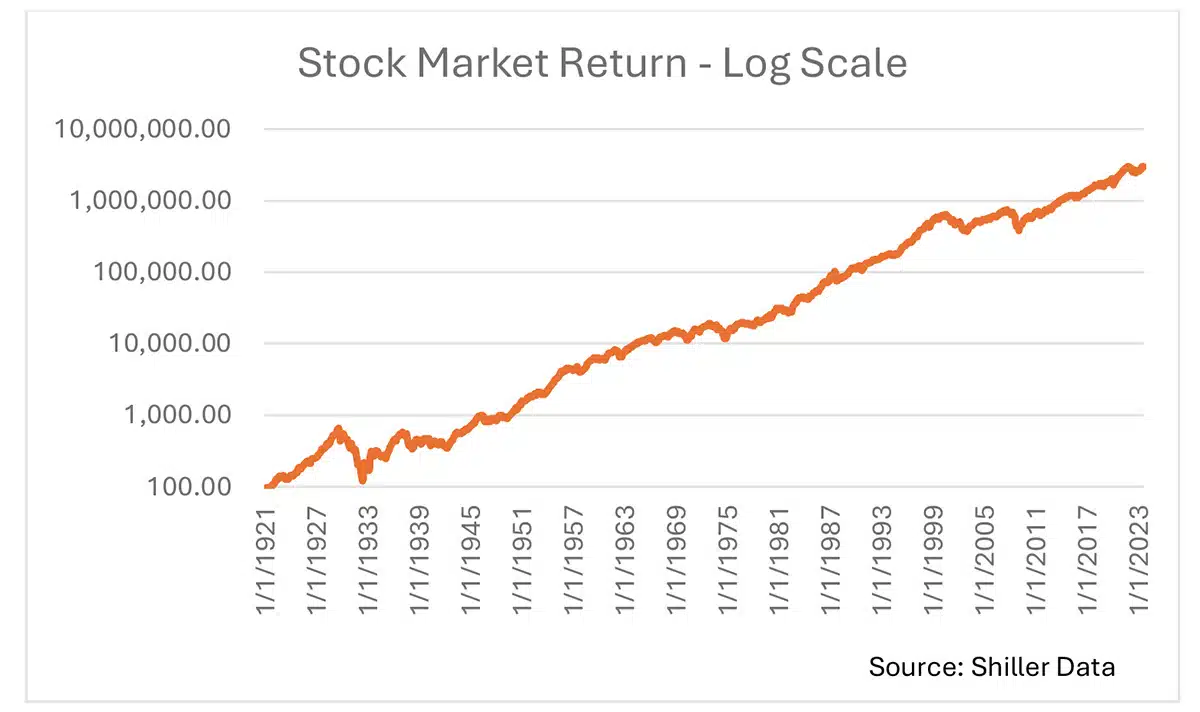
Switching to a logarithmic scale helps a bit. You can clearly see the 1929 market crash, but the 22% market drop in 1987 hardly stands out at all. You can also see that after the 1929 market crash, it took 29 years for the market to regain its previous 1929 high. In 1987, the market was back to its previous high in under 2 years. Also, log scale charts are not easy to interpret aside from knowing that a straight line represents a constant rate of growth and that a bend upward denotes a higher growth rate and vice versa.

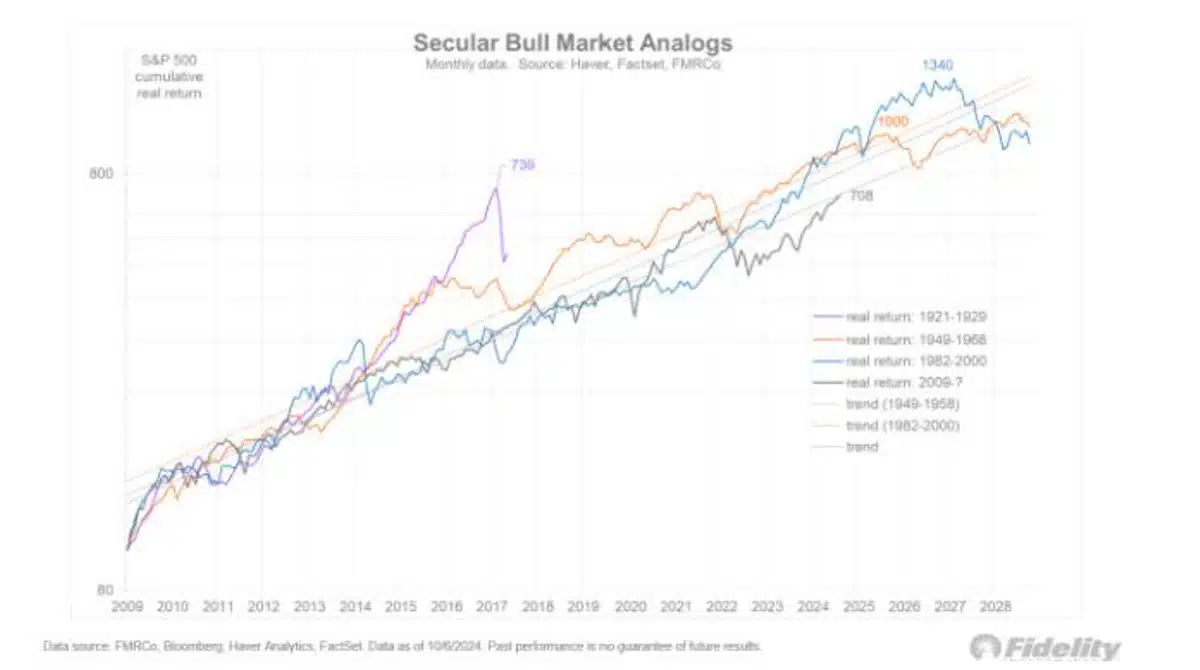
This is why, I am a big fan of Jurrien Timmer’s work. Below, he looks at long-running bull markets which have lasted 15 year or more and plots our current situation alongside. Yes, this is a logarithmic chart, but it places different time periods side by side rebasing each series to start at 100. The big outlier in the chart, of course, is the purple line representing the 1929 market crash. Compared to these bull markets in the 1950s-60s, and 1990s, the current market looks like it may have further to run.

Of course, this may not prove to be the best indicator of how the market will perform in the future. As Mark Twain famously said: “history doesn’t repeat itself, but it rhymes.” As interesting as these charts are, it remains almost impossible to effectively time the market which requires being right twice: first, when to step aside, and when to get back in. But a little knowledge of market history, I believe, makes us better, and more patient, investors.

Explore smarter retirement planning beyond target date funds with a customized glide path built for your goals and risk tolerance.

Thoughtful planning creates confidence. Prepare your finances, career, and family goals for a stronger, more focused 2026.

Before you invest, protect your plan. Discover how Matt Williams uses protection-first planning to build stronger, more resilient financial strategies.

Discover how financial organization and comprehensive planning can protect your family, reduce stress, and create lasting peace of mind.